Wheel-Rail Profile Optimization through Vehicle Modeling on Vancouver’s SkyTrain
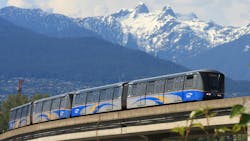
Vancouver’s SkyTrain has a well-documented history of wheel and rail optimization projects. It has also historically struggled with issues like rail corrugation and its attendant problems of excess noise and vibration, higher incidence of rail defects and high wheel and rail wear rates.
When it originally opened in 1986, the transit system only had the Expo Line. It has since grown to comprise new lines and multiple extensions that include the Expo Line, the Millennium Line and the Canada Line for a total of 49.5 miles of track.
British Columbia Rapid Transit Company (BCRTC), which operates the Expo and Millennium lines on behalf of TransLink, is currently amid a multi-year, system-wide wheel/rail profile optimization program; a program made more complex because the fleet, which includes three generations of cars (the Mk I, Mk II and Mk III), uses steerable bogies.
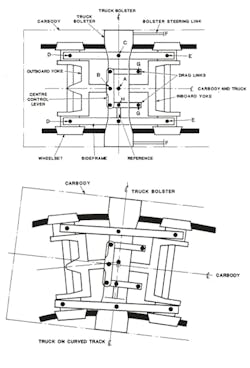
The oldest generation vehicle in the fleet, the Mk I, is equipped with a complex bogie (see figure 1, top). In this design, steering force input is transmitted through the bolster steering link (labeled F). Figure 1 (bottom) shows a diagram of the Mk I bogie navigating a curve, giving a better sense of its dynamic movement and how the various linkages interact, Lei Chen, principal engineer for rolling stock at BCRTC, told delegates at the 2024 Wheel/Rail Interaction Rail Transit Conference.
Figure 1
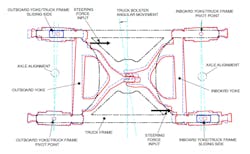
The Mk II and Mk III fleets share a steerable bogie design that is very different from the Mk I (see figure 2). The linkage and articulation are noticeably less complex. It also differs from the Mk I in the opposite-corner layout of its steering force inputs.
“Steerable bogies navigate curves very well, and they prevent substantial rail gage-wear [in curves], but they have downsides, too,” said Teodor Pirvoaica, lead mechanical engineer, SkyTrain.
For example, tight curves without adequate spirals on entry/exit pose a problem because, in such cases, there are periods in which one bogie on a car is navigating the curve while the other is still in tangent track. This causes the tangent bogie to take an angle of attack as if it were curving.
“We often see high gage wear in the tangent track preceding and after the curve in these locations,” Pirvoaica said.
Steerable bogies also alter the way wheel and rail profiles interact—relative to standard bogies—and can make profile optimization a significantly more complex undertaking.
Figure 2
Wheel and rail profiles
Prior to BCRTC’s wheel/rail optimization project, the Expo and Millenium lines used universal rail profiles, i.e., the same profile was used in tangent track and curves. Pirvoaica notes that while this is serviceable, it is not optimal.
A combination of high wheel-wear and defect rates, and accelerating rail wear throughout the system, prompted BCRTC to initiate a wheel/rail interaction (WRI) study in 2017. Pirvoaica notes the study indicated that the current wheel and rail profiles were not compatible with Mk I, II or III bogies.
Rail profile measurements taken in tangent track (see Figure 3) show the measured profile (red) versus the design profile (blue). Pirvoaica explains the high rate of wear that occurs at 13 - 35 degrees to gage (marked in green) is indicative of tangent wear throughout the system.
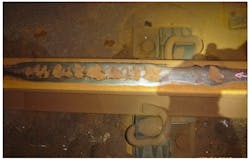
Severe and rapidly developing rail corrugation is another issue that continued to vex BCRTC after the 2017 WRI study. If there is rail that BCRTC is unable to grind quickly enough, corrugation can advance to the point of significant spalling (see figure 4), often requiring the affected area but cut out to insert plug rail. At the time of the study, Pirvoaica says BCRTC was re-truing wheels at only approximately 80,000 km (49,709 miles) due to high wear rates and the high incidence of hollow-worn wheels.
In 2020, BCRTC developed a program to address its interrelated wheel and rail wear and defect issues. The agency has since worked with the National Research Council of Canada (NRC) to develop compatible wheel and rail profiles that complement the dynamic behavior of the fleet’s steerable bogies.
Figure 3
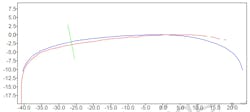
Figure 4
Modeling wheel/rail interaction
In 2020, the NRC developed preliminary optimized wheel and rail profiles with the intention of further validating them through additional simulation. Since then, the council has added dynamic modeling of multiple wheel and rail combinations to its analysis.
“The design process was initially done using quasi-static analysis to validate profiles,” said NRC Project Engineer Alexandre Woelfle. “We’ve since moved on to dynamic modeling for more thorough and accurate simulation.”
The NRC initially developed models for each of the three vehicle types. The Mk I was used sparingly since documentation for them was scant, and they are being phased out of service. The better-documented Mk II and III, which showed very similar performance characteristics in preliminary simulations, provided a better representation of operations on the system. The NRC focused its efforts on the Mk II. The simulation model consisted of six major rigid bodies: the car body, bogie frame, outboard and inboard yokes, bolster and wheelsets.
The NRC also created track models for tangents, mild curves and sharp curves for the Expo and Millennium lines and the Evergreen extension. The track and vehicle models were used in three simulation approaches, each with a different methodology and goal:
- Evaluating the wheel/rail profile performance in tangents and curves (for multiple combinations of profiles).
- Sensitivity analysis to determine which input parameter has the greatest impact on wheel/rail performance.
- Quasi-static analysis to investigate wheel/rail contact and conicity.
Figure 5 shows the parameters and values that were used to evaluate wheel/rail profile performance in tangent track; performance was evaluated by three metrics (found in the FRA standard CFR 213.333): truck lateral acceleration root mean square (RMS), car body lateral acceleration RMS and car body lateral accelerations peak-to-peak.
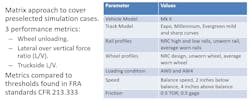
The parameters used to evaluate wheel/rail profile performance in curves (see figure 6) follow the same philosophy as the tangent evaluation, but performance evaluation is based on different metrics (also found in CFR 213.333): wheel unloading, the wheel lateral-to-vertical force ratio (L/V) and truckside L/V.
The sensitivity analysis used the same parameters as the previous analyses but further includes:
- Hourglass spring stiffness (new, 20 percent reduction and 50 percent reduction)
- Lateral damper rate (new, 40 percent reduction and 80 percent reduction)
- Top-of-rail coefficient of friction (0.2 to 0.5 in increments of 0.05)
Figure 5
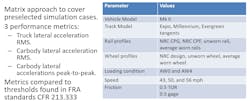
Figure 6
Results
Based on the dynamic modeling, the NRC made some changes to its preliminary profile designs. While the preliminary curve rail profiles met or exceeded all of the performance metrics measured in the dynamic simulations, Woelfle says the NRC determined that the preliminary tangent rail profiles could have induced some lateral vehicle instability.
“The 2024 profile requires a little more metal removal than the 2020 design but the performance benefits outweigh that factor,” Woelfle said, adding that once the 2020 tangent rail profile was redesigned, the wheel profile design performed well in simulations.
Sensitivity analysis determined that the parameters that most affect vehicle stability (in descending order of impact) are:
- Wheel profile
- Rail profile
- Vehicle speed
- Vehicle weight
- Lateral damping
- Coefficient of friction at the top of rail
- Vertical suspension stiffness
“The parameters in this analysis put a lot of importance on lateral accelerations,” Woelfle said. “If you’re looking at a different metric, the order is likely to change.”
This type of analysis is particularly useful to understand if changes in the system are caused by the implementation of new profiles.
What’s next?
BCRCT and NRC are establishing test sites where the new rail profiles can be implemented and monitored over the next three to four years. Wear rates, corrugation development and profile evolution are of particular interest.
“We’re also interested in seeing if any of these changes affect the mismatched angle of attack on the bogies of cars that are partially in a curve and partially on tangent track,” Woelfle said.
Implementation of a new wheel profile will take place concurrently. Wheel profiles will be measured at least twice per year to determine the wear rate and profile shape.
It's a process, but the results—and the comprehensive understanding of the unique characteristics of the system that modeling and dynamic simulation provide—have enabled BCRCT to confidently move forward to improve wheel/rail interaction on the system.
About the Author

Jeff Tuzik
Jeff Tuzik is managing editor of Interface Journal. His work appears through an agreement with Wheel/Rail Seminars of which Mass Transit is the presenting sponsor.