MTA posts best on-time metrics in four years
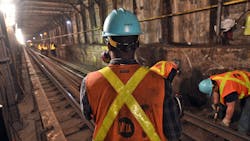
The Metropolitan Transportation Authority (MTA) is crediting a months-long improvement trend to the effectiveness of the Subway Action Plan and the Save Safe Seconds Campaign.
MTA's new statistics show that its subway network posted the best on-time performance and the fewest number of delays that the system has seen in four years.
“Our concerted efforts are paying off in the form of fewer delays, less waiting, faster trips and an overall better experience for our customers,” said MTA New York City Transit President Andy Byford. “These are sustainable improvements resulting from a ‘back to basics’ focus on maintenance and operational practices, but we’re also limited by an aging infrastructure; in order to achieve the subway system that New Yorkers deserve and that Transit employees are capable of delivering, we need sustainable, adequate funding through means such as congestion pricing to help us modernize the system.”
The Subway Action Plan was launched in July 2017 and focuses on repairs and maintenance while the Save Safe Seconds Campaign began a year later and focuses on operational practices.
Weekday on-time performance in January was 76.7 percent, about 19 points higher than January 2018, which was 58.1 percent. January also represents the fifth consecutive month that the Department of Subways exceeded its goal of reducing 10,000 delays each month. In January 2019, there were 42,348 weekday delays, compared to 76,287 in January 2018. Weekday major incidents – incidents causing 50 or more delays – are also drastically down in January, with 52 compared to 105 in January 2018.
Weekend on-time performance is also drastically improved. In January 2019 compared to January 2018, there were seven major incidents compared to 14; 83.1 percent on-time performance compared to 64.7 percent; and 8,180 delays compared to 18,931.
Delay-inducing track fires caused by debris are also significantly down – a direct result of aggressive debris cleanup under the Subway Action Plan. In January 2019, there were 23 track debris fires, compared to 42 in January 2018. In the 12 months leading up to January 2019, there were 322 track fires related to debris, compared to 452 the previous year.
Other metrics are also showing improvement. Additional unanticipated time spent waiting on platforms is down (to 1m11s compared to 1m35s) and additional unanticipated time spent on trains is down (to 58s compared to 1m46s). Mean distance between failures in subway cars is up slightly, elevator availability is also up slightly.
About the Author

Mischa Wanek-Libman
Group Editorial Director
Mischa Wanek-Libman is director of communications with Transdev North America. She has more than 20 years of experience working in the transportation industry covering construction projects, engineering challenges, transit and rail operations and best practices.
Wanek-Libman has held top editorial positions at freight rail and public transportation business-to-business publications including as editor-in-chief and editorial director of Mass Transit from 2018-2024. She has been recognized for editorial excellence through her individual work, as well as for collaborative content.
She is an active member of the American Public Transportation Association's Marketing and Communications Committee and served 14 years as a Board Observer on the National Railroad Construction and Maintenance Association (NRC) Board of Directors.
She is a graduate of Drake University in Des Moines, Iowa, where she earned a Bachelor of Arts degree in Journalism and Mass Communication.
