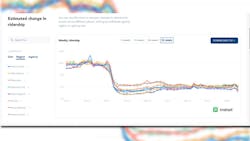
APTA and Transit join forces on new Ridership Trends dashboard
As transit agencies across the U.S. continue to adjust service and staffing levels as they contend with the pandemic, the American Public Transportation Association (APTA) and Transit app have joined forces to provide the industry with a new tool: the APTA Ridership Trends dashboard.
The dashboard, which is available at www.transitapp.com/APTA, will provide week-by-week estimations of public transit ridership for agencies across the U.S.
“APTA is excited to announce this new partnership with the Transit app,” said Paul P. Skoutelas, APTA president and CEO. “Agencies around the country need up-to-date information to help them make critical business decisions during this unprecedented pandemic. This new partnership will benefit our members and riders all around the nation.”
During the COVID-19 pandemic, public transit ridership has risen and fallen rapidly in response to public health alerts across the country. These changes make it difficult for public transit agencies that rely on monthly or quarterly reporting to follow up-to-date ridership trends and benchmark against their peers. To tackle this challenge, APTA and the Transit app have partnered to build a new resource for the entire industry, tracking demand for public transit and publishing estimates of ridership change in real time.
“We work hand-in-hand with transit agencies around the country every day,” said David Block-Schachter, chief business officer of Transit. “Agencies are looking for new, faster ways to gather data in order to respond to rider demand. The number of people using our app for transit information is a great barometer for estimating overall ridership in near real-time. Together with APTA, we’ve been able to refine this data to provide insights to the entire industry.”
Transit’s team also analyzes route-level and system-wide origin-destination data, to provide transit agencies with up-to-date information about rider demand in its Transit Dashboard.
User surveys by Transit have shown the demographics of its users to be broadly reflective of public transit ridership at large in the U.S., including during the pandemic. The company has provided a real-time tracker of public transit demand on its website since the start of the pandemic and found its demand indicators to track closely with actual ridership statistics.
Methodology
Estimated values for each week are statistically modelled based on measures of Transit app usage and do not represent actual reported ridership counts from agencies. App usage is attributed to a particular transit agency if that agency’s service appears as a nearby option for the user when they open the app.
Transit app usage statistics count the frequency of how often the app is opened, providing a measure of demand for public transit while considering additional factors such as regional trends and current severity of the pandemic.
