Occupancy Data: A Real Crowd Pleaser
The COVID-19 pandemic has changed how people approach many situations, but none so drastically as how they contend with and avoid crowds. Proximity to others can be viewed as unsafe in the current climate.
The traditional rush hour crowding found on public transit has shifted out of the realm of slight annoyance and minor inconvenience and into one that is a personal health and safety concern. While several global studies have found no correlation between transit use and COVID-19 transmission, more effort will be needed to change perceptions and boost rider confidence and trust.
One way agencies have been changing perceptions is by providing information on crowding levels of transit vehicles. Since June, agencies including Société de transport de Laval, Sun Tran, Massachusetts Bay Transportation Authority (MBTA), Chicago Transit Authority, Long Island Rail Road, Bay Area Rapid Transit, New Jersey Transit and Los Angeles County Metropolitan Transportation Authority (Metro) have all taken the step of sharing some form of vehicle occupancy information with their riders.
This information can be crowdsourced from fellow riders, based on historical data or provided in real time. Transit surveyed 6,000 of its app users in June 2020 on transit crowding in five North American cities and found their threshold for crowding to be much lower during the pandemic. Prior to COVID-19, the survey found more than 60 percent of riders would board a transit vehicle “even if riders were packed like sardines.” Now, the survey found more riders prefer to sit alone.
The survey also asked about real-time occupancy information and its perceived value and impact on riding habits. More than 70 percent of respondents said real-time occupancy information would be used to plan their trips differently, while 30 percent reported they would use transit more often if provided the information. Regarding value of occupancy information, the survey found more than 60 percent would ride transit more often if real-time information was provided versus less than 20 percent for crowdsourced occupancy information and approximately 30 percent for historical information.
Automated passenger counters (APCs) provide the foundation of occupancy data. APCs are growing in their adoption within transit fleets. APTA tracks several connected vehicle technologies in its annual Public Transportation Vehicle Database, which was most recently published in July 2020. The APTA 2020 Vehicle Database reports that approximately 40 percent of all U.S. transit vehicles have APCs installed, which is up from 35.5 percent reported in the APTA 2019 Vehicle Database. Bus rapid transit fleets have the most vehicles with APCs at 76 percent followed by bus fleets at 70 percent, commuter buses at 58 percent and light-rail vehicles at 42 percent.
Having the right hardware is one aspect of sharing occupancy data, the second is how the information from APCs is collected, processed and shared. For this, industry vendors have developed several solutions to fit agency needs.
Delivering Information Riders Appreciate
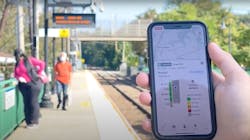
Transit automatically integrates real-time crowding information into its app when this information is provided by transit agencies. Stephen Miller, Transit’s communications lead, explains the company also recognizes that producing this real-time feed from APC data can be challenging for many agencies.
“To that end, we've begun working with transit agencies to analyze patterns in their existing APC datasets and produce predictions for expected crowding. That way, riders can know if the trip they are interested in taking is usually crowded or typically has plenty of space for physical distancing,” said Miller.
L.A. Metro was the first system to launch Transit’s predictive crowding feature and Miller notes the crowding predictions provided by Transit had 88 percent accuracy when compared to actual APC counts.
“We're already working with other transit agencies to bring crowding predictions to their riders and will soon be building in crowdsourced crowding information to our GO step-by-step navigation feature. By asking riders directly about crowding on their trip, we'll be able to not only fill in the gaps when real-time data might be missing, but we can also look at riders' experiences to help inform our agency partners' benchmarks,” said Miller. “For example, crowdsourced crowding data can ensure the definition of ‘crowded’ meets not only public health guidance, but also riders' own expressed comfort level onboard.”
Transit’s crowdsourced crowding feature will launch in October for riders with the more than 75 transit agencies that have made Transit their officially-endorsed app, before rolling out later to all transit agencies.
Miller explains some agencies have expressed concern about potential negative attention that may come from sharing which of their services are experiencing crowded levels. However, there is also a recognition that riders appreciate knowing the crowding levels before they board a vehicle.
“In many ways, this echoes debates from a decade ago about providing real-time arrival estimates: riders appreciate knowing if their bus is late and would rather be informed in advance, instead of being kept in the dark about their journey. Today, real-time countdowns are a must-have for any transit agency and crowding information is following a very similar trajectory,” said Miller.
Beyond the pandemic, Miller says Transit sees crowding information continuing to be of use to riders because it improves their overall experience.
“For riders with wheelchairs, strollers or large luggage, it helps to know in advance if they'll have enough space onboard for a comfortable trip or if they'd be better off waiting for the next ride. And even for riders taking the bus on their everyday commute, crowding information provides peace of mind,” said Miller. “Improving the accessibility and experience of public transit always pays dividends and that will be true of crowding information when the pandemic is behind us.”
Validating Health and Accuracy of APCs
Trapeze Group is a re-seller and integrator of APC technology on-board transit vehicles. The company’s CAD/AVL solution, TransitMaster, integrates with the on-board APC system and supplies the information to a fixed-end system. Vehicle occupancy information can then be fed to applications using GTFS-Realtime or imported to the Trapeze Traveler Experience suite.
“Historically, real-time APC data has not been broadly used in daily operations, but with the heightened focus on the data and ensuring it is accurate in real-time, we believe that there will be greater trust in this data and use of the data when making operational decisions such as adding service to a given route with high passenger volume to reduce bus bunching and passenger pass-ups,” explained Nathan Reynolds, director, product management at Trapeze.
Trapeze’s solution alerts the control center as passenger volumes exceed a defined threshold for a route or for vehicles on a route. The company believes this capability will be utilized more to proactively address routes with heavy passenger volume.
Trapeze has worked with clients such as MBTA in Boston, Mass., and Sun Tran in Tucson, Ariz., to go live with occupancy data. While working with customers, Reynolds says there are a couple of best practices Trapeze can offer:
1. Validating health of APCs, resolving issues and ensuring plans are in place to proactively maintain APC technology is vital to providing quality data to the public.
2. Validating real-time accuracy of APCs prior to going live with the data is critical. Real-time occupancy information does not get the benefit of hindsight or a full day’s activity that post-processed APC data gets. The type of APC, boarding behaviors and APC maintenance play a major role in the quality of APC data in real-time and, thus, the real-time data needs validation prior to go live.
“As more agencies provide occupancy information, it is very possible/likely that knowing the real-time occupancy of transit vehicles will become an expectation and used in the decision making process by riders as to how they move about a city,” said Reynolds. “Even after the pandemic eases, many of us will likely still be quite cautious about being in extremely crowded situations for some time and, thus, will take advantage of real-time crowding information.”
Real-Time Origin-Destination Data
Keolis has developed its own solution for real-time information called DotPulse – Dot stands for destination, origin, time. DotPulse is based on Wi-Fi counting, which is a proven approach utilized in other busy hubs, such as airports and shopping malls. Jean Ghedira, executive director of marketing and new mobilities with Keolis, explains the company adapted the concept to the world of public transport using existing equipment and developed software to provide real-time counting data, passenger loads, origin-destination, wait time, passengers pathways, transfer information, fraud alert and more.
“The information is delivered through our platforms and API to be delivered to passengers. The data generated is complete enough to build robust predictive models using origin-destination data,” said Ghedira. “Thanks to this solution, agencies and operators can give their passengers a predictive occupancy rate in real-time.”
The information provided through DotPulse can also be used in Keolis Evolve, which assesses mobility needs within a community, regardless of travel mode, and provides system recommendations to better serve the community’s needs. Ghedira explains meshing DotPulse information into Keolis Evolve will bring an understanding of passengers’ origins and destinations. This allows Keolis to collaborate with its partner agencies to design more direct services to shorten travel times and, ultimately, regain the trust of passengers.
DotPulse has been successfully deployed on a dozen French networks, such as Paris and the city’s surrounding region, South-East France and Lyon. Ghedira says DotPulse is part of a new global approach to public transport that will enable operators and agencies to have a precise, real-time view of what is happening on the network. DotPulse contains data on traffic and weather in addition to public transport data, and Ghedira says Keolis is starting to integrate this data into predictive tools.
“Producing and communicating occupancy rates to passengers is an important first step; the second one is to adapt the network to avoid overloaded vehicles and stations,” said Ghedira. “This second step will require a predictive model, changes in operations and contractualization with agencies and, of course, time.”
Ghedira believes real-time occupancy information and a complete mobility picture of a community will evolve into a “must have” for passengers and agencies.
“We believe that real-time occupancy information is a one of the pillars of a larger data ecosystem. GPS data from smartphones is the second pillar to collect data on all journeys for each mode (cars, bikes, walking),” said Ghedira. “Having all mobility information, real-time occupancy information, operational information and external data in the same system will be the key to making tomorrow’s networks work.”
Consistent Outward Communication
The capability to count passengers is one element of ENGIE Solutions turnkey solution, which includes hardware to count riders boarding/alighting, processing the data aboard the vehicle to determine how many riders are currently in the bus or rail vehicle and communicating this information in real-time through the Occupancy Level information of the GTFS-Realtime feed. The company ensures accuracy by first installing reliable counters at all doors, which can record up to 98 percent accuracy, and then processing the data with its in-vehicle intelligence, which avoids outlying data.
In working with its global customer base, ENGIE Solutions says the main concern is defining what a full bus means. The information can then be displayed by percentage status or by occupancy status, such as “full,” “some crowding” and “not crowded.” Another key point is to ensure the information displayed over different media, such as in an app, on Google Maps and signage in stations or at stops, is consistent. If an app displays “bus full,” but signage communicates something different, the information works against rider confidence.
While properly communicating with customers is enough motivation to get the technology right, Kilian Ollivier, business development manager – North America, for ENGIE Solutions, believes the value of real-time occupancy data will be found far beyond the current health crisis.
“Even in a post-pandemic world, I believe most people will retain new practices for years. Safety will most likely be a central thought in peoples’ minds,” said Ollivier. “Therefore, we don’t see this kind of practice, sharing real-time occupancy, disappearing. We also live in world where everything is at our fingertips, so riders will expect to know if their next bus/train is full or not.”
Short- and Long-Term Solutions
INIT offers two occupancy data solutions to its transit customers. The first allows customers with an APC system and Intermodal Transport Control (ITC) System based on cellular radio to view occupancy rates of a bus or train vehicle and feed the information into passenger-facing systems such as rider apps or signage at stops.
“The relevance of real-time passenger load data going out to the public is that it gives riders control over which vehicles they feel comfortable riding based on the occupancy levels,” said Ann Derby, director marketing and events for INIT Innovations in Transportation Inc.
The occupancy rate is calculated by percentage and displayed to the dispatcher with default values and color codes. An example could be with a green color if the vehicle occupancy is 0-40 percent, yellow if the occupancy is 60-80 percent and red if the vehicle is 80-100 percent. Once a vehicle reaches the “full” threshold defined by the agency, they can display a “drop off only” message on the vehicle head sign and/or put another bus onto the route to meet demand.
The second solution, MOBILEguide, is INIT’s passenger guidance system and is for customers who have the company’s planning system, MOBILE-PLAN, which can allocate occupancy rates to trips and/or trip sections. This information can be exported to journey planning systems so that the passenger can be informed about the expected occupancy rate of a trip before starting the trip.
Derby says in the long term, MOBILEguide can detect the actual carload of each section of the train in real time, deduct the number of people expected to exit a train at the following station, then calculate and display the expected carload to waiting passengers. The “expected exits” are determined through historical data and accounting for factors such as the particular stop, line, time and type of service day.
“MOBILEguide uses high-precision passenger counting results, as well as historical data and machine learning to accomplish this task,” said Derby. “This leads to a more even distribution onboard vehicles and at stations. The results are faster boarding and transfer processes, increased comfort for the passengers, shorter dwell times and a better use of the agency’s resources.”
Derby explains managing crowds on transit vehicles plays a major role in winning back passenger confidence, but she and INIT believe crowd management is here for the long term.
“Real-time passenger loads relayed to riders will help them plan the journey that best suits their comfort level and travel needs. It will become an expected passenger service and be vital in helping restore public confidence in taking public transportation again,” said Derby.
About the Author

Mischa Wanek-Libman
Group Editorial Director
Mischa Wanek-Libman is director of communications with Transdev North America. She has more than 20 years of experience working in the transportation industry covering construction projects, engineering challenges, transit and rail operations and best practices.
Wanek-Libman has held top editorial positions at freight rail and public transportation business-to-business publications including as editor-in-chief and editorial director of Mass Transit from 2018-2024. She has been recognized for editorial excellence through her individual work, as well as for collaborative content.
She is an active member of the American Public Transportation Association's Marketing and Communications Committee and served 14 years as a Board Observer on the National Railroad Construction and Maintenance Association (NRC) Board of Directors.
She is a graduate of Drake University in Des Moines, Iowa, where she earned a Bachelor of Arts degree in Journalism and Mass Communication.