Optibus releases new tool to help improve transit equality
Optibus has released an impact analysis tool to help cities visualize the impact of transit changes on the surrounding community.
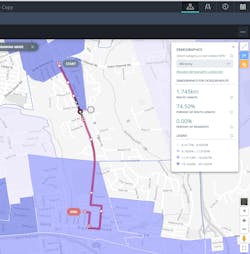
The tool, which is fully integrated with Optibus’ transit planning and scheduling capabilities, enables cities and transit operators to visualize and understand how route changes will affect selected demographic groups living along those routes. They will also be able to seamlessly plan routes, schedules and rosters using the impact analysis, all on a single platform.
“Public transit isn’t just about vehicles, but about the cities and towns where transit provides an essential service for residents,” said Optibus CEO and co-founder Amos Haggiag. “By helping cities analyze the impact of their existing transit service and the service changes they need to make, especially as we begin easing out of lockdown, Optibus makes it easier for transit agencies and operators to incorporate impact analysis into their everyday planning and scheduling.”
Examining the effect of service changes on the city’s population can help transit providers answer critical questions like: If service was reduced on certain routes, who lives along those routes? Do those residents still have regular access to the places they need to go?
U.S. transit providers can use Optibus’ impact analysis tool to help them meet the federal Title VI requirements to conduct service equity analyses for major service changes. The tool uses up-to-date nationwide data about demographic groups in the U.S., which transit providers can customize based on their needs.
Since the tool is a built-in component of the planning and scheduling process, Optibus says transit providers can find it easy to use on a regular basis, in line with the broader spirit of equality and not just the requirements of federal regulations. They can also use the impact data to seamlessly compare multiple scheduling scenarios and view business metrics like peak vehicle requirement and total cost (including vehicle and driver costs) – giving them the information needed to make good decisions fast.