What Happens to Dispatch Data After the Disruption Is Resolved
Key Highlights
- CleverCAD for Rail keeps delivering operational value long after a service disruption is resolved
- CleverMetrix delivers real-time performance dashboards for rail OCC managers, supervisors, and planning teams.
- CleverReports compares planned versus delivered rail service to reveal patterns for smarter scheduling decisions.
- CleverInsights turns rail ridership data into a reliable, funding-ready record for service planning.
- One connected rail data source means real-time, historical, and ridership views reflect the same reality.
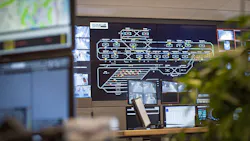

A delay clears. The board goes green again. For most coverage of computer-aided dispatch (CAD) systems, that's where the story ends. The system did its job, the disruption is managed, and operations move on.
But for complex rail operations control centers (OCCs), that moment is only half the picture. Every headway deviation, delay code, and recovery action a CAD system like CleverCAD logs during a service event doesn't disappear once the dispatch is closed. It becomes part of a much larger operational record that keeps working long after the incident itself is forgotten by anyone who wasn't in the OCC that day.
A system built to run and remember
Rail agencies already understand CAD's real-time value: visibility into every in-service vehicle, coordinated dispatch, and the tools to build and execute recovery plans when something goes wrong. CleverCAD for Rail has been built around exactly that mission, giving OCCs the situational awareness and disruption-management tools needed to keep service moving.
What's less discussed is what happens to the data that the CAD system generates over the course of a normal operating day. Every data point, from schedule adherence, dwell times, and headway to incident logs, is also an input into decisions that get made outside the OCC, like service planning, funding compliance, and long-term investment.
Three ways the data keeps working
Seeing performance in real time, everywhere it's needed
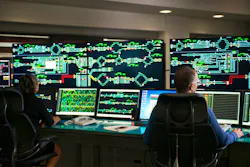
Not every stakeholder who needs operational visibility is sitting at a dispatch console. CleverMetrix takes the same data CleverCAD is already collecting and puts it into real-time dashboards tailored to each department and role. On-time performance, ridership status, and incident tracking are configured for whoever needs to see it, whether that's a supervisor, a planner, or an executive team reviewing system health.
Turning the day's performance into tomorrow's plan
CleverReports measures the schedule that was planned against the service that was actually delivered within 24 hours of that service running. That comparison of plan versus reality, sustained over weeks and months, is what turns a single day's dispatch log into a pattern: the segments that reliably run behind, the recovery strategies that actually work, the places where the timetable itself might be asking too much. It's the kind of trend visibility that makes planning and resourcing decisions evidence-based rather than anecdotal.
Understanding who's on board, not just how the trains ran
Operational performance is only half the story rail agencies need to tell. The other half is ridership. CleverInsights cleans, validates, and visualizes ridership data specifically for all modes of rail operations, turning raw counts into a reliable records agencies can use for service planning and for demonstrating the ridership levels tied to funding eligibility. CleverInsights is used within transit agencies by Automatic Passenger Counting (APC) processing personnel, route and stop planners, schedulers, management, and many others.
Why this only works as one system
None of this works if the three views are pulling from three different, disconnected sources that have to be reconciled by hand after the fact. The advantage of a unified CAD and business intelligence architecture is that CleverMetrix, CleverReports, and CleverInsights are all drawing from the same operational data CleverCAD is already generating, which means the real-time view, the historical trend, and the ridership record all describe the same reality, rather than three separate ones an agency has to stitch together.
The bigger question
Most conversations about CAD systems focus on the two minutes of a service disruption and how quickly the system helps an OCC understand the problem and respond. That's an important measure, and rightly so. But for agencies evaluating a CAD investment for the long term, it's worth asking a second question: what does the system do with the rest of the day? The data generated during routine operations, not just the exceptions, is what ultimately shapes better timetables, stronger funding submissions, and more informed decisions about where an agency's next investment should go.
A data foundation built to last
That question matters more than ever as rail agencies plan technology investments built to last. A CAD platform that treats every dispatch event as a lasting operational asset gives agencies a foundation that holds its value for as long as the system is in service.