Vehicle Design Part 2: Managing Noise and Vibration from the Ground Up
In Part 1 of this article, a group of experts, including a transit operator, three vehicle manufacturers, and a noise and vibration consultant, examined how to mitigate wheel/rail-generated noise at the source. The discussion took place at the Wheel/Rail Interaction ’23 Rail Transit conference, of which Mass Transit is the Presenting Sponsor. Part 2 looks further into vehicle design efforts to mitigate noise and vibration and the resulting effects on transit/passenger applications.
Rail transit vehicle design doesn’t occur in a vacuum. In addition to optimizing individual components of a vehicle, car builders also optimize the vehicle for the rail and track conditions it will encounter. This means that precise track condition data is an important component of the vehicle design process despite not being part of the vehicle.
During the design phase of a new vehicle, car builders use track condition data in concert with their own analyses and simulations to quantify the systemic effects of vehicle/track interaction on:
- Vehicle kinemtatics, including articulation angles, coupler and carbody clearances and carbody-to-truck clearance.
- Vehicle dynamics based on wheel/rail profile interaction, the ability to navigate special trackwork, derailment risk and ride comfort.
- Propulsion and braking requirements, including gradients, station stops, acceleration and deceleration requirements.
- Structural loads/forces — these are subject to customer specification, car builder internal standards and regulatory requirements.
“Structural load assumptions in the design phase are very important: Are you following only the technical specification or only the regulatory requirements? And, what do you do when these come into conflict?” asked Kevin McClain, director of mechanical systems engineering at Siemens Mobility Inc.
Reconciling this conflict requires good data and good communication with the customer.
Siemens recently fulfilled a new vehicle procurement contract that highlights the importance of having and using track and site data in the vehicle design process. This procurement was for an existing network that included historic trackwork and bridges requiring a lightweight vehicle. Sections of the network were also near historic buildings and particularly sensitive to ground-borne vibrations. The network was in a high-gradient landscape, which McClain explained included many steep grades back-to-back, as well as sharp curves and compound curves at grade.
A vehicle optimized for these conditions had to be lightweight, with low unsprung mass and exceptionally fatigue-resistant due to large predicted torsional loads — and it had to be service-proven. Siemens’ approach to the project was to first define trackwork criteria based on a combination of track drawings, track measurements and measurements of existing vehicle dynamics. McClain said the aim was to use the worst-case scenario out of these data sources to determine the true operational envelope of a new car.
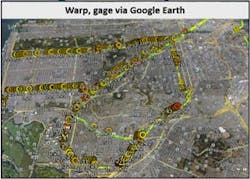
Siemens instrumented existing cars with a suite of measurement devices to create its own map of the network overlaid with truck and carbody dynamics and loads, correlated by precise location. Among the many parameters Siemens measured, certain track conditions appeared to be particularly consequential in their influence on vehicle performance. These were warp 31 feet, warp 62 feet and narrow gage.
"These are combinations of conditions and forces that can’t be found in technical drawings,” McClain said.
Siemens also collected rail profile data and used it to inform multibody simulation (MBS) models —essentially enabling them to run simulated cars over simulated tracks reflecting actual track conditions. Notably, the as-measured track simulated structural loads were, on average, 20 percent higher than the track drawing simulation, McClain added, meaning that a car designed to the track drawing spec would effectively be under-built.
Using this profile data, Siemens developed MBS models to test the individual components of the new car on the as-measured track and identify potentially problematic combinations of components, vehicle dynamics, kinematics, structural loads and locations.
Siemens found that the vehicle/track characteristics measured (relating to kinematics, dynamics, propulsion, structural load) more accurately reflected the actual operating conditions than the technical specifications or standards. These were the characteristics that drove the new car design.
According to McClain, the lesson here is simple: Accurate track data plays a critical role in the design phase of new car procurement.
Noise and vibration at the source
A recent case study in Sydney, Australia, illustrates the impact of vehicle design and selection on ground-borne vibration and noise. The initial focus of the study was a rail corridor for Sydney’s heavy rail passenger line (North Sydney) that was undergoing modification for a light-rail extension of the Sydney Metro. At the commencement of the study, only the heavy rail line was in operation. During the months that followed, the inbound track was moved to accommodate construction of two metro tracks between the existing tracks, said Briony Croft, an acoustic engineer and director at Sahaya Consulting (Canada) and Acoustic Studio (Australia).
The study measured vibration at the rail corridor boundary for more than a year (and is ongoing), collecting data on roughly 250 trains per day. The original goal was to measure changes in vibration data due to the track configuration changes related to the metro expansion.
“We collected so much data that we’ve been able to extrapolate much more than that,” Croft said.
Analysis of this data has yielded information on:
- Long-term trends in vibration levels over time
- Differences between tracks
- Relative vertical and lateral vibration levels
- Repeatability of short-term vibration monitoring
- Effect of train type on vibration levels
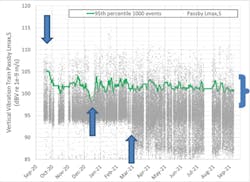
Figure 3 shows some of the data collected in the study – specifically vertical vibration data during one year. The green line shows the 95th percentile of maximum vibration levels, averaged more than 1,000 events (95th percentile vibration level is a metric used for vibration standards and compliance in Australia).
Croft noted there are three stand-out points in this data that warrant closer examination. The first is the notable commencement of large numbers of train passby events with lower vibration levels in March 2021. This corresponds to the opening of the new inbound track, which was further away from the vibration sensor. The second is the spike in vibrations at the start of study. This corresponds to a proliferation of wheel flats related to issues with newly-acquired rolling stock. Croft added the issue was resolved soon after data collection for this study commenced, resulting in reduced maximum vibration levels by October 2021.
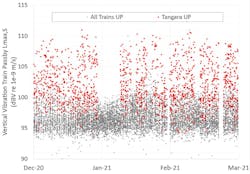
The third is the drop-off of the 95th percentile between December 2020 and January 2021. This corresponds to a period in which maintenance work on the Sydney Harbor Bridge disrupted normal operations. During this period, the line ran a reduced timetable service, utilizing only one train type — the Waratah type.
The Waratah trains were introduced between 2011 and 2018 and make up 81 percent of the traffic on the North Sydney line. Tangara trains, introduced between 1988 and 1995, make up 16 percent of the traffic and the remaining three percent is made up of other train types.
“The Tangara are older but very similar in specification to the Waratah trains,” Croft said. "The differences between these trains becomes quite clear, however, when the Tangara trains are highlighted in the vibration data. The Tangara trains, despite making up a small percentage of the fleet, account for nearly all of the high vibration events. On average, the Tangara trains generated +5 dBV vertical vibrations and +6 dBV.”
Croft explained the Waratah and Tangara trains have very similar suspension systems and only a small difference in unsprung mass; otherwise, the two vehicles are not substantively different. For the Sydney case study, this left wheel flats as the likely culprit for the cars’ different performance.
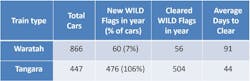
To compare wheel condition between the two car types, Croft looked at wheel impact load detector (WILD) data network-wide during the same time period as the vibration data. This data showed that out of 866 Waratah cars, 60 (seven percent) generated WILD flags. Of the 447 Tangara cars, 476 (106 percent) generated WILD flags.
“This made it clear that wheel flats were driving the difference in vibration events,” Croft said.
Maintenance records showed that there was no marked difference in how or where the car types were maintained — in fact, wheel flats were corrected faster, on average, on the Tangara cars versus the Waratahs. This is where the only fundamental design difference between the two cars plays a role. The Tangara cars use DC traction and friction braking at low speeds while the Waratah cars have more modern AC traction systems and use dynamic braking at all speeds. Wheel flats generated as a function of this design difference contributed to significant differences in vibrations. This shows the importance of vehicle design or selection when you’re mitigating vibrations.
“The general assumption was that vibration levels for the two car types should be the same since they’re simply a different generation of the same car,” Croft said.
The Sydney case study illustrates one of the less-obvious ways in which car design can affect a transit system. It also illustrates the fact the optimization of the vehicle/track dynamic doesn’t necessarily end once a vehicle is designed and delivered.
Wheel/rail profile interaction and optimization, like vehicle/track interaction, has a profound influence on the kinds of characteristics and performance specifications that transit systems and car builders target. Wheel and rail profile matching can be part of the new car design/procurement process but it can also be part of the maintenance/operational phase of car deployment.
As Siemens’ McClain detailed, vehicle/track interaction (and optimization) is a critical component of delivering a well-designed vehicle. Wheel/rail interaction takes that optimization a step further, to a more granular level. Transit properties commission wheel/rail studies for many reasons. The goal may be to improve curve performance or eliminate hunting, for example. Arne Pfeil, product dynamics engineer/railways dynamics expert at Alstom, noted often transit properties commission a study when an aspect of their system begins to perform out of band, perhaps a new vehicle is experiencing excessive flange wear or generating excessive noise.
Regardless of the specific reason for the study, the first step is recording and analyzing the wheel/rail conditions. Alstom collects wheel and rail profile measurements and track geometry data and uses the information to determine an optimized rolling radii difference from the system.
“If you want to run through a curve without any longitudinal creepage, the outer wheel must have a greater radius than the inner wheel,” Pfeil said.
For every curve in the system, there is a dedicated optimal rolling radius difference that does not induce longitudinal creepage. Of course, there are many different curves in every system and wheelsets must be able to navigate them all. Pfeil notes that based on curve distribution, Alstom calculates the best-fit rolling radius difference and wheel conicity that will optimize performance and minimize wheel/rail wear.
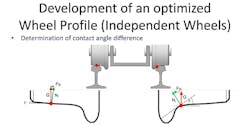
This process is different for independently rotating wheels, as they lack an axle to induce longitudinal creepage. However, this also means they don’t have a self-centering effect. In this case, profile optimization involves adjusting the contact angle of the wheel. According to Pfeil, increasing the contact angle as the wheel moves toward the flange results in higher lateral forces aimed at preventing flange contact while the wheel is running in tangent track.
Like Siemens and Stadler, Alstom also uses multibody simulations throughout the profile design process to model wear patterns, potential development of two-point contact and the propensity for corrugation to develop, Pfeil said. This allows for the testing of multiple profiles with a level of specificity and granularity not possible in the field, he added.
On the track side, rail reprofiling and transition to one (or more) standard rail profiles typically starts by grinding to a transitional profile and then to the target profile.
“The goal is to achieve the target profile as part of the regular grinding program, which is gradual, but more economical,” Pfeil said.
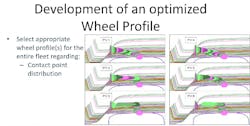
Concurrently, intermediate wheel profiles can be designed to better match the reprofiled and non-reprofiled rail conditions. Once the track has fully transitioned into the standard profile (or profiles), multiple wheel profiles can be developed that match the rail and distribute wear more uniformly, in that each profile is designed to contact the rail at a different point.
The process of optimizing wheel and rail profiles is also beneficial in that it feeds back into the new vehicle procurement process when the time arises. The data collected during the process can be used by car builders to further optimize their designs, as Siemens’ Kevin McClain pointed out. Knowing the operating parameters of the track/wheel/rail system means that a vehicle designed for that system can be more specialized and better able to target customer specifications, rather than account for a broad range of sub-optimal operating conditions.
The vehicle procurement and design process touches on nearly every discipline and principle in the rail transit industry. Optimizing performance while minimizing noise and vibration is a process that starts at the vehicle specification and never really ends. The throughline is the importance of good data, thorough analysis, reliable simulation and a holistic approach to vehicle/track interaction.
About the Author

Jeff Tuzik
Jeff Tuzik is managing editor of Interface Journal. His work appears through an agreement with Wheel/Rail Seminars of which Mass Transit is the presenting sponsor.