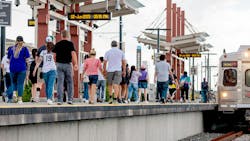
Denver RTD’s latest customer and community survey shows agency’s improvement in several categories
The most recently conducted Denver Regional Transportation District (RTD) customer and community surveys show double-digit, year-over-year improvements in several categories, including perceptions of personal safety and security, the cleanliness of buses and trains, on-time performance, the frequency of service and the agency’s overall value in the Denver metro area.
Denver RTD’s bus operations exceeded the national average for transit agencies in all 16 comparative categories, and rail operations exceeded the national average in 15 of the 16 comparative categories. The survey results also highlighted the fact that “getting to work” is the primary reason people use Denver RTD’s bus and rail services, up more than seven percent from 2024.
“The survey results reflect [Denver] RTD’s direct impact and value public transit has across the communities it serves within the Denver metro area,” said Denver RTD General Manager and CEO Debra A. Johnson. “Over the last year, the agency has implemented several consequential tactics related to creating a welcoming transit environment and enhancing the customer experience. The results of [Denver] RTD’s strategic and multi-faceted efforts are evident, and while I am encouraged to see that [Denver] RTD is nationally leading the way across several categories, the agency remains focused on the future and continuous improvement.”
The survey was conducted for a fifth consecutive year for the agency to better understand its strengths and identify opportunities for improvement. In April, research firm ETC Institute conducted the annual surveys and provided comparative national data and benchmarks.
According to the agency, four separate statistically valid surveys were conducted to better understand customer and community perceptions, attitudes, experiences and opinions. The bus and rail surveys were conducted using a customer intercept method, which allowed researchers to gather immediate, real-time feedback from individuals using Denver RTD's services. The agency says the survey method ensures feedback is provided by actual customers and that the data collected is proportionate to boardings across all bus routes and rail lines.
Net promoter score (NPS)
Denver RTD says the NPS measures the likelihood that a person would recommend Denver RTD's services to someone else, based on a scale between -100 and +100. Denver RTD’s combined customer NPS increased 24 points in 2025, and the score is up 13 points for bus and 19 points for rail. The agency notes the across-the-board positive NPS means it has more individuals promoting its services than acting as detractors. Denver RTD’s NPS in the community increased 36 points in 2025 and is up 58 points from 2023.
Bus customers
- 78 percent of respondents are reliant on Denver RTD’s services.
- 85 percent agree or strongly agree that Denver RTD provides value to the community.
- 71 percent use Denver RTD’s services three or more days a week.
- An eight percent year-over-year increase in overall satisfaction.
- An 11 percent increase in customers feeling safe and secure while waiting at a stop.
- A 13 percent increase in customers indicating the vehicles are clean.
- A seven percent increase in customers satisfied or very satisfied with the frequency of service.
- A four percent increase in customers indicating bus operators are courteous.
- Bus exceeded the national average across all 16 comparative categories.
- Bus’s NPS is +26, and the national average is –16.
- The factors of most importance to bus customers are frequency of service, hours of operation, stop location, fare price and timely arrival of buses.
Rail customers
- 65 percent of respondents are reliant on Denver RTD’s services.
- 59 percent use Denver RTD’s services three or more days a week.
- A 12 percent year-over-year increase in overall satisfaction.
- A 17 percent increase in customers indicating the trains are clean.
- A seven percent increase in customers satisfied or very satisfied with the frequency of service.
- A 10 percent increase in customers indicating the trains run on time.
- A 14 percent increase in customers feeling safe and secure while riding the train.
- A 12 percent increase in customers feeling safe and secure while waiting at a station.
- A five percent increase in customers indicating rail operators are courteous.
- Rail exceeded the national average in 15 of the 16 comparative categories.
- Rail’s NPS is +31, and the national average is –3.
- The factors of most importance to light-rail customers are frequency of service, station location, fare price, hours of operation and timely arrival of trains.
Paratransit customers
- 85 percent of Access-a-Ride customers are satisfied or very satisfied.
- 96 percent of Access-on-Demand customers are satisfied or very satisfied.
- Access-a-Ride’s Net Promoter Score is +54.
- Access-on-Demand’s Net Promoter Score is +81.
Community
- Getting to work is the primary reason people use Denver RTD’s services, up seven percent from 2024.
- An 11 percent increase in the community indicating that Denver RTD provides value to them personally.
- 82 percent believe their investment in Denver RTD provides value.
- 83 percent indicate Denver RTD is valuable or extremely valuable at reducing pollution and achieving sustainable practices.
- 90 percent feel that Denver RTD vehicles are mechanically safe.
- 80 percent feel Denver RTD is valuable or extremely valuable at reducing traffic congestion.
The agency notes all surveys were conducted in English and Spanish, with language assistance available in an additional 20 languages, as well as accommodations for customers who are blind or visually impaired. Surveys were administered to a representative sample of the customer and community population to ensure the results were statistically valid.
More information about the surveys’ methodology and confidence intervals is available on Denver RTD’s website.
