L.A. Metro, Measure Up! and RIITS partner to better understand travel patterns and help inform transportation policies and operations throughout LA

The Los Angeles County Metropolitan Transportation Authority (L.A. Metro), Measure Up! and the Regional Integration of Intelligent Transportation Systems (RIITS) have partnered to collect, share and analyze transportation data to better understand travel patterns and help inform transportation policies and operations throughout the Los Angeles region. Measure Up! LOCUS are dashboards that provide info from transportation trips based on data from smartphones and other connected devices that is aggregated and algorithmically analyzed so no personal information is identified or accessible.
Measure Up! LOCUS includes two dashboards reflecting datasets from 2017 and the second half of 2019/2020. L.A. Metro used the 2017 dashboard for its innovative NextGen Bus Study to restructure its service to best meet LA County transportation needs.
The new 2019/2020 dataset includes additional transportation/travel behavior information, including walking, biking, public transportation, auto, goods movement and commuting. Building on the NextGen Bus Study, L.A. Metro’s Office of Strategic Innovation will use the new 2019/2020 dataset to track progress toward L.A. Metro’s Vision 2028 strategic plan goal of doubling the percentage of people who commute by walking, cycling, taking transit or other ways that don’t involve driving. L.A. Metro is also sharing licenses to use the datasets with other public agencies and researchers.
Goods movement and truck travel data
Measure Up! LOCUS also includes goods movement truck travel data, a first-of-its-kind visual representation of the Heavy-Duty Truck model (HDT) developed by the Southern California Association of Governments (SCAG) as part of its Goods Movement Program.
By including goods movement analyses in the new dashboards, L.A. Metro is standardizing a comprehensive suite of transportation data in an easy-to-use format.
Data insights
The table below summarizes L.A. Metro’s Vision 2028 strategic plan goal of doubling the percent usage of transportation modes other than driving alone (transit, walk and bike) from 16.6 percent in the baseline year of 2019 to 33.2 percent by 2028.

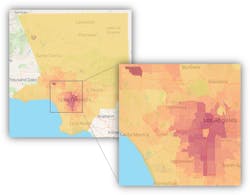
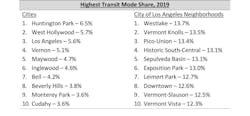
Weekday transit share by city and neighborhood, 2019
The Measure Up! LOCUS dashboard shows how travel and mode use patterns vary across the region’s diverse communities. The following cities and neighborhoods had the highest share of weekday transit trips in 2019 (Neighborhoods are based on the LA Times Mapping LA project).
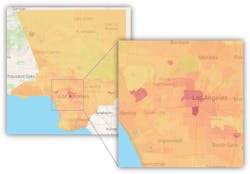
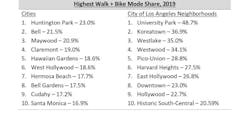
Weekday walk and bike share by city and neighborhood, 2019
The following cities and neighborhoods had the highest share of weekday walking and biking trips in 2019.
Weekday commute patterns and telecommuting
The dashboards are also able to study commuting and work from home patterns by analyzing “the trip not taken,” comparing 2019 commute patterns to those in 2020. This data may be particularly useful for studying the change in regionwide pandemic commuting patterns and tracking how these trends may hold during COVID recovery.
According to the Locus Commuting Pattern model, in 2020, there was a 35 percent regionwide reduction in commuters compared to 2019. The following cities and neighborhoods show the largest reductions in commuting patterns.
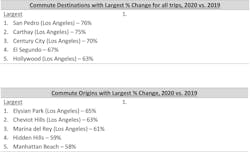
The changes in commuting patterns above are anticipated to be a guide for telework and may reveal changes in transportation behavior in LA County.