Poverty Endures: Poverty Rate Fell Slightly, but Areas of Concentrated Poverty Expands
Since 2014, Metropolitan Council research staff have tracked trends and geographic patterns of poverty in the Twin Cities region — in particular, concentrated poverty, which is known to have a potentially negative affect on residents' economic mobility, health, and overall well-being. Throughout the report, the council refers to "poverty" as those with income below 185 percent of the federal poverty threshold in 2015. In other words, a family of four with income below $44,875, or a single adult with an income below $22,352 in 2015.
Recently released American Community Survey data from the U.S. Census Bureau offer the latest look at Areas of Concentrated Poverty. Key findings from the new data include:
After a four-year plateau following the Great Recession, the region's overall poverty rate fell slightly for the second consecutive year.
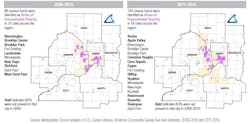
- Over the past decade, areas of concentrated poverty have expanded in the cities of Minneapolis and Saint Paul as well as in the suburbs.
- This growth took place near established concentrated poverty — especially in Saint Paul.
- Nine new suburban areas had Areas of Concentrated Poverty for the first time in 2011-2015.
- Areas of Concentrated Poverty vary with respect to demographic and housing characteristics; other than poverty, there is no single characteristic that distinguishes them from the rest of the region or each other.
Drilling down:
Poverty rates in Minneapolis and Saint Paul (combined) are more than double that of the region's suburban and rural communities (for example, in 2011-2015 Minneapolis and Saint Paul's combined poverty rate was 39.2 percent, compared with that of the region's suburban and rural areas, 17.4 percent). However, the region's suburban and rural areas have added many more residents in poverty both by number and by share between 2000 and 2011-2015. In fact, the region's suburban and rural communities had 1.5 times the number of residents in poverty in 2011-2015 (about 388,000 residents) compared with Minneapolis and Saint Paul (about 263,000 residents).
Between these two time periods, 2006-2010 and 2011-2015, several cities experienced double-digit increases in the share of residents in poverty, including Spring Lake Park (+11.5 percent), Hopkins (+11.3 percent), Columbia Heights (+10.4 percent), Anoka (+10.3 percent), and North Saint Paul (+10.0 percent). Yet other cities saw sizeable declines in their share of residents in poverty over this time period, such as Carver (-11.2 percent), Arden Hills (-6.2 percent), and Oak Grove (-6 percent). In 2011-2015, the cities with the highest shares of residents in poverty were Saint Paul (40.8 percent), Brooklyn Center (39.5 percent), Columbia Heights (39.1 percent), Minneapolis (37.9 percent), and Anoka (37.3 percent). It's clear that even in the post-recession years, poverty is present, spreading, and in some cases deepening.
Research on concentrated poverty suggests it may have an overarching impact on residents — even those who are not themselves low-income — such as reducing potential economic mobility and negatively affecting their overall health and well-being. Further, where one lives matters, because it influences both the level of access and the assortment of opportunities available in the regional landscape.
See the full MetroStat report, http://www.masstransitmag.com/12311694