What projects could see funding under the infrastructure bill? Look to STIPs.
The Infrastructure Investment and Jobs Act, which the Biden Administration calls the Bipartisan Infrastructure Law, will direct up to $108 billion to the transit industry over the next five years.
One way to identify projects that are likely to get some of that money is by looking at documents called Statewide Transportation Improvement Programs(STIPs).
States are federally mandated to develop STIPs in cooperation with local and regional organizations that do transportation planning, such as Metropolitan Planning Organizations, Regional Transportation Planning Organizations and public transit authorities. The Federal Transit Administration has a description of STIPs and the processes that states must follow to assemble them. Additionally, STIPs typically contain descriptions of how they were put together by the state agencies that issue them.
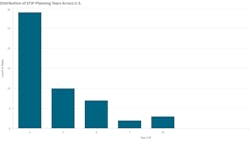
STIPs are required to cover periods of at least four years and be updated at least that often. While a few states have STIPs as long as 10 years, most keep them to four years, as is shown by the bar chart below, which uses data taken from STIPs by business intelligence provider FirmoGraphs.

How frequently states update their STIPs depends in part on how much work they do on their transportation infrastructure. New York, for example, last approved its most recent STIP, which covers the 2020-2023 federal fiscal years, in October 2019, but it has so many transportation projects going on at any given time that it makes information on them available for download on a monthly basis.
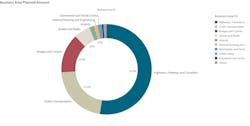
The STIPs in FirmoGraphs’ database list a little more than 70,000 projects currently slated to receive roughly $590 billion in the 2021-2024 fiscal years. (Note: FirmoGraphs categorizes both projects and programs as projects.) Of that, nearly $313 billion, or 52 percent, is for projects in the highways, freeways and turnpikes business area, which are getting the most money out of the 20 that FirmoGraphs categorizes STIP projects. The business area getting the second-highest amount money is public transportation, which has projects slated to receive $127 billion. (A visual representation of the planned spending in STIPs broken down into business areas can be seen below.)
Of the $127 billion planned for transportation projects, $22.6 billion was slated to be spent in fiscal year 2021, followed by $15.1 billion in 2022, $14 billion in 2023, $11.7 billion in 2024 and $4.9 billion in 2025. The decrease over time doesn’t mean states will spend less on public transportation in each succeeding fiscal year, but instead reflects the fact that the future is uncertain. Barring emergencies, a state knows almost every transportation project that will receive funding in the first fiscal year of its STIP, so that fiscal year typically will contain the highest total funding. The state is less sure which projects will receive funding in the next fiscal year, so that fiscal year typically will have less total funding and so on.
Not surprisingly, the state planning to spend the most on public transportation projects in its 2021-2024 fiscal years is California, which intends to spend $16 billion. New York ($6.2 billion) is a distant second, with New Jersey ($6.14 billion) almost its equal, followed by North Carolina ($5.1 billion) and Washington ($4.4 billion). The graphic below, called a treemap, visually represents all 50 states by how much they plan to spend on public transportation projects in their 2021-2024 fiscal years.
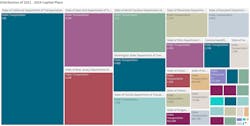
As seen from the treemap, six of the 10 most expensive public transportation projects in the documents in Firmographs’ database are in California, including the only two with costs exceeding $4 billion — the Santa Clara Valley Transportation Authority’s BART Silicon Valley Phase II Project, which is valued at $4.8 billion; and Phase Two of the Transbay Joint Powers Authority’s Transbay Transit Center Program, which costs $4.3 billion and includes a 1.3-mile extension of Caltrain commuter rail in San Francisco, two train stations and a bus station.
The other California projects among the 10 most expensive public transportation projects in FirmoGraphs’ STIP database are BART’s Transbay Corridor Core Capacity Program ($3.51 billion) and railcar procurement program ($2.73 billion); the Caltrain Electrification ($1.98 billion); and the Automated People Mover, an electric train system being built at Los Angeles International Airport.
New Jersey has two projects among the 10 most expensive public transportation projects in FirmoGraphs’ STIP database, although both are actually programs. One is a rail rolling stock procurement program ($2.88 billion) and the other is a rail preventive maintenance program ($2.59 billion).
New York only has one project among the 10 most expensive public transportation projects in FirmoGraphs’ STIP database, but it’s a biggie — Airtrain LGA, an elevated train that would serve La Guardia Airport and would cost $2.05 billion to construct.
It’s beginning to look, however, like Airtrain LGA may not make it off the ground. As a Mass Transit article pointed out last month, private company AmeriStarRail is proposing an alternative called the AirTrain LaGuardia JFK System, which would provide direct links between Metro-North and John F. Kennedy International Airport, and between the Long Island Rail Road and LaGuardia.
That’s a good reminder that, although STIPs are good starting places for trying to identify projects that the bipartisan infrastructure law could fund, not all the projects in them will reach fruition.
Or, as Yogi Berra might have said had he worked in transportation: Even if a project appears in a STIP, it ain’t funded till it’s funded.
--------------
David Cox, PE, is president of FirmoGraphs, a business focused on applying business intelligence to North American public infrastructure and utilities.
About the Author
David Cox, PE
President, FirmoGraphs
Dave Cox is the president and founder of FirmoGraphs, a business focused on applying Business Intelligence (BI) to North American public infrastructure and utilities. He earned a BS in Civil Engineering from the University of California at Berkeley, and an MS from the University of Texas at Austin in environmental engineering. He is a California Professional Civil Engineer. Dave has spent his 30-year career doing engineering, marketing, and sales work with asset-intensive organizations in the energy, water, oil, and technology industries. He is passionate about using data to help North American industry make better decisions to improve both financial performance and the environment.