According to a report released today by the American Public Transportation Association (APTA), Americans took 10.4 billion trips on public transportation in 2011, the second highest annual ridership since 1957. Only ridership in 2008, when gas rose to more than $4 a gallon, surpassed last year's ridership. With an increase of 2.3 percent over the 2010 ridership, this was the sixth year in a row that more than 10 billion trips were taken on public transportation systems nationwide. During 2011, vehicle miles of travel (VMTs) declined by 1.2 percent.
"U.S. public transportation ridership in 2011 is now the second highest ridership since 1957," said APTA President and CEO Michael Melaniphy. "What is exciting is that the uptick in ridership occurred in large, medium and small communities, showing the broad support that public transportation has nationwide. In fact, the largest rate of growth was in rural communities with populations under 100,000 where public transit use increased by 5.4 percent."
"Two top reasons for the increased ridership are higher gas prices and in certain areas, a recovering economy with more people returning to work," said Melaniphy. "Since nearly 60 percent of trips taken on public transportation are for work commutes, it's not surprising to see ridership increase in areas where the economy has improved."
Noting that the increased use of passenger information technology is also contributing to higher ridership, Melaniphy said, "The exponential growth of apps to track bus and rail arrival times is demystifying the ridership experience and attracting new customers to public transportation. More and more people are now able to find out when the next bus and train will arrive through public transit apps. This is making public transportation more attractive."
"There should be no doubt Americans need and want public transportation," said Melaniphy. "Congress needs to pass a well funded, multimodal, multi-year transportation bill that will help meet current and growing demand."
To see the complete APTA 2011 ridership report, go to http://www.apta.com/resources/statistics/Documents/Ridership/2011-q4-ridership-APTA.pdf
2011 Ridership Breakdown
Light rail (modern streetcars, trolleys, and heritage trolleys) ridership increased 4.9 percent in 2011. Light rail systems that showed increases in 2011 were located in the following cities: Seattle, Wash. – King County DOT (37.2 percent); Dallas, Texas (31.2 percent); Buffalo, N.Y. (15.6 percent); Oceanside, Calif. (14.8 percent); Salt Lake City, Utah (14.4 percent); Seattle, Wash. – Sound Transit (11.8 percent); New Orleans, La. (11.3 percent); Philadelphia, Pa. (9.6 percent); San Diego, Calif. (7.3 percent); and Memphis, Tenn. (6.3 percent).
Heavy rail (subways and elevated trains) ridership increased by 3.3 percent across the country. Heavy rail systems with increases in ridership for 2011 were in the following cities: Cleveland, Ohio (12.3 percent); San Juan, Peurto Rico (12 percent); Baltimore, Md. (8.7 percent); Boston, Mass. (7.2 percent); San Francisco, Calif. (5.6 percent); Chicago, Ill. (5 percent); Miami, Fla. (4.9 percent); New York, N.Y. (4.9 percent); Philadelphia, Pa. (4.7 percent); and Lindenwold, N.J. (3.9 percent).
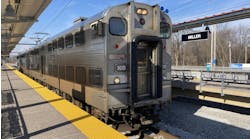
Nationally, commuter rail ridership increased by 2.5 percent in 2011. With a new rail line extension that opened in December 2010, the commuter rail in Austin, Texas, saw an increase of 169 percent due to additional and weekend service. The follow six commuter rail systems saw double digit increases in 2011: Nashville, Tenn. (33 percent); Oceanside, Calif. (21 percent); Portland, Ore. (20 percent); Alexandria, Va. (12.7 percent); Salt Lake City, Utah (10.4 percent); and Stockton, Calif. (10.3 percent). Commuter rail systems that also reported increases were: Oakland, Calif.(8.3 percent); Seattle, Wash. – Sound Transit (7.6 percent) and Anchorage, Alaska (7 percent).
Large bus systems reported an increase of 0.4 percent nationally. The following bus systems showed an increase: Columbus, Ohio (10.1 percent); Saint Louis, Mo. (10 percent); Orlando, Fla. (8.4 percent); Miami, Fla. (8.3 percent); Washington, D.C. (7.1 percent); San Diego, Calif. (6.8 percent); San Antonio, Texas (6.3 percent); Arlington Heights, Ill. (4.6 percent); Minneapolis, Minn (4.3 percent); and Baltimore, Md. (3.9 percent).
Demand response (paratransit) ridership increased in 2011 by 3.2 percent and trolleybus ridership increased by 1.2 percent.
Separate from the 2011 ridership report, below is a sampling of 2012 ridership that shows continued momentum and increased ridership nationwide.
Albany, N.Y. - Capital District Transportation Authority
January – Increased 13 percent - Experiencing record ridership; Expect to close with 14.5 million boardings for this fiscal year (to close on March 31st.) Expected to be the highest ridership in close to 25 years.
Ames, Iowa – CyRide
January – Increased 7.5 percent
February – Increased 9.8 percent
Ann Arbor, Mich. - Ann Arbor Transportation Authority
January and February – Increased 7.2 percent each month
Arlington Heights, Ill. – Pace Suburban Bus
January – Increased 7.5 percent
Boston, Mass. – Massachusetts Bay Transportation Authority
January – Increased 10.2 percent; January marked the 12th consecutive month of ridership growth at the MBTA.
Burnsville, Minn. - Minnesota Valley Transit Authority
January – Increased 2 percent
February – Increased 8 percent
Charleston, S.C. - Charleston Area Regional Transportation Authority
January – Increased 16.76 percent
Cleveland, Ohio - Greater Cleveland Regional Transit Authority
January - Increased 5.3 percent; Nine consecutive months of increased ridership.
College, Pa. - Centre Area Transportation Authority
January – Increased 2.5 percent
Columbus, Ohio - Central Ohio Transit Authority
January – Increased 6.1 percent
Corpus Christi, Texas – Corpus Christi Regional Transportation Authority
January – Increased 9.1 percent
Durham, N.C. - Durham Area Transit Authority (DATA)
January - Increased 15.6 percent
Fort Myers, Fla. – Lee County Transit
January – Increased 20.8 percent -Record double digit ridership for the past six months
Grand Rapids, Mich. – The Rapid
January – Increased 12.2 percent
Houston, Texas - Metropolitan Transit Authority of Harris County
January - Increased system wide 5.2 percent; Six consecutive months of increased ridership.
Indianapolis, Ind. - Indianapolis Public Transportation Corporation
January – Increased 19.09 percent
Kansas City, Mo. - Kansas City Area Transportation Authority
January – Increased 16.76 percent
February – Increased 21.12 percent
Los Angeles, Calif. - Los Angeles County Metropolitan Transportation Authority
January - Rail increased 3 percent; Bus increased 1 percent
Muncie, Ind. - Muncie Indiana Transit System
January – Increased 5.21 percent
February – Increased 17.4 percent
Nashville, Tenn. - Nashville Metropolitan Transit Authority & Regional Transportation Authority
January – Increased 16.7 percent; anticipate hitting a combined MTA/RTA milestone of 10 million passenger trips this fiscal year which ends June 30.
Oakland, - Calif. - Capitol Corridor Joint Powers Authority
January – Increased 7 percent
Olympia, Wash. – Intercity Transit
January – Increased 4 percent
February – Increased 11.6 percent
2011 was the highest ridership for the system in 31 years
Orange, Calif. – Orange County Transportation Authority
January – Increased 2 percent
Orlando, Fla. – LYNX
January – Increased 7 percent
Peoria, Ill. - Greater Peoria Mass Transit District (CityLink)
January – Increased 16 percent
Philadelphia, Pa – SEPTA
January – Increased 6 percent
Phoenix, Ariz. - Valley Metro Rail
January – Increased 8.3 percent
February – Increased 5.1 percent
Pompano Beach, Fla. - Broward County Transit Division
January – Increased 8.9 percent
Reading, Pa. - Berks Area Regional Transportation Authority
January - Fixed route increased 8.9 percent
Research Triangle Park, N.C. – Triangle Transit
January - Increased 30.7 percent; Have had double digit increases for Triangle Transit every month since January 2011. The lowest has been around 17 percent, the highest was 33.9 percent in August 2011
Richmond, Va. - Greater Richmond Transit Company
January - Increased 6.8 percent
Salt Lake City, Utah – Utah Transit Authority
January – Increased 6.5 percent;
San Antonio, Texas - VIA Metropolitan Transit
January – Increased 10.07 percent; experiencing tremendous growth in ridership recently with record ridership numbers for January 2012.
San Carlos, Calif. - SamTrans | Caltrain
January – Increased 34.7 percent
San Jose, Calif. - Santa Clara Valley Transportation Authority
January - Bus and Light Rail increased 3.5 percent
Seattle, Wash. – Sound Transit
January - Light Rail increased 5 percent; ST Express Regional Bus increased 8.2 percent
Springfield, Mo. - City Utilities of Springfield, Mo.
January – Increased 15 percent
February – Increased 24 percent
State College, Pa. - Centre Area Transportation Authority
January – Increased 2.5 percent
Urbana, Ill. - Champaign-Urbana Mass Transit District
January – Increased 5.2 percent
February – Increased 10.7 percent
Wilmington, Del. – Delaware Transit Corporation
January – Weekday increased 15.1 percent


