The transportation industry, like just about every other structured modern enterprise, relies on accurate, useful and usable information to keep transit systems and highways in the best possible conditions to meet the demands of the traveling public. Transportation planners and engineers must analyze much relevant data before making decisions that help networks and roadway systems operate safely and efficiently. And, new research findings can greatly impact and influence transportation forecasting and policy analysis.
In fact, a study was commissioned in 1998 by the U.S. Department of Transportation Research and Special Programs Administration to identify the value of good data within transportation. The report, “Value of Information and Information Services,” identified these three key benefits:
- Reduced costs of agency research, technology development, and operations
- Quicker implementation of innovations and time savings
- More effective decision making at all levels of the agency
New research is imperative to guide development and expansion of all forms of transportation in our increasingly mobile society. This means metropolitan transit agencies and highway departments are under greater scrutiny to make better decisions on providing service and allocating funds to meet increasingly growing demands on networks and highways.
In many communities across the nation, use of public transit continues to increase. Findings from a report released in early 2015 by the American Public Transportation Association (APTA) support this contention: “Americans took 10.8 billion trips on public transportation in 2014, which is the highest annual public transit ridership number in 58 years.” According to APTA, this surge in bus and rail ridership took place in an era of steadily declining prices for gasoline.
Yet, Americans continue to take to the highways in record numbers as populations soar in many major metro areas. The Federal Highway Administration (FHWA) reported that vehicles traveled 277.3 billion miles on American roadways in August of 2015, the highest number ever recorded for that month. What’s more, the findings, published in the FHWA’s Traffic Volume Trends report, also reveal that “the series of monthly mileage increases now stands at 18 consecutive months.”
Different Route for Developing Mode Choice Model
Clearly, transportation planners could benefit from new resources to plan for the continued growth of public transit ridership and highway travel. For years, planners have employed a four-step process to develop forecasts for transportation networks. Mode choice, or computing the proportion of trips between an origin and destination using a particular mode of travel, is the third step in a conventional four-step model. Also in more advance microsimulation frameworks, this component plays a key role in predicting congestion by splitting the trips among different modes of travel.
For years, researchers have developed models that incorporate population information and spatial location to simulate transportation activity. Under some tried and true forecasting methods, transportation data that was aggregated or focused on market segments had limited value for building activity-based mode choice models. The reason: Most models built within these parameters incorporated data that was not always accurate because the information failed to identify alternative transportation options available to the typical suburban commuter or growing family of city dwellers.
Advanced technology -- specifically the availability of mobile apps, mobile networks, and comprehensive satellite imagery -- has the potential to be a game-changer in helping researchers build more accurate models to project mode choice decisions. That’s exactly what researchers affiliated with the University of Illinois at Chicago’s Urban Transportation Center incorporated in order to develop a new mode choice model for metropolitan Chicago.
Breaking Down the Model
The model is described in the paper: “ Mode Choice Modelling Using Personalized Travel Time and Cost Data.” Researchers under the direction of Civil and Materials Engineering Professor Dr. Abolfazl (Kouros) Mohammadian, used Travel Tracker Survey data collected by the Chicago Metropolitan Agency for Planning (CMAP), the state-managed metropolitan planning organization, to provide information from eight counties surrounding Chicago. The population sampled in the survey matched the region’s household population by county. Designed for travel modeling, this information let researchers analyze more than 170,000 trips taken by people during a 14-month period starting in 2007. An estimated 218,000 travel activities were recorded.
The model is built upon complicated mathematical and probability theories which are well-known and largely used in choice modeling science. In summary these models take information of decision makers and the choices they had to make and try to form a formula that could predict the chosen alternative. In the case of a mode choice model, for example, the traveler is the decision maker and mode choices are auto, transit or bike, or walking. This information is usually collected through recording daily travel activities of a group of individuals. For example one individual could report leaving from home to work at 8 a.m. by car, and arriving at work at 9 a.m. Although auto information is gathered through the survey, what is not collected here is information of other modes of travel (e.g. how long it would it take to travel by bus or train).
Traditionally the missing information is synthesized using other aggregate models, which involved many assumptions and approximations; but mathematical models as are good so long as they are used with accurate data. In this study, UIC researchers embarked upon an innovative approach and consulted Google Map and Bing Map websites to collect more accurate point-to-point travel information for all trips reported in the travel survey. This way they synthesized the missing information using prevailing traffic conditions, and a key motive was to test the hypothesis that travel mode choice models could be improved by using well-known mapping apps data.
It should also be mentioned that this type of model could prove their application even more when they are incorporated into larger microsimulation frameworks, called Activity-based Travel Demand models. This framework allows researchers to synthesize individuals in a study region in order to simulate their activities and keep track of transportation options based upon a person’s location and other characteristics. Also, it helps planners more accurately predict the number of shares of each mode under various transportation-related policies.
When analyzing the Travel Tracker Survey data, the research team decided to build the model mainly on trips that originated from a survey respondent’s home. As explained in the paper:
“It is noteworthy that home-based trips with their origin at-home were selected for these mode choice models since trips that are not home-based are highly associated with their respective home-based origin trip within a tour (a tour is a combination of trips, which starts and ends at home). This means when an individual starts a tour which is comprised of several trips, the mode of the first trip that originates from home highly affects the mode of the later trips.”
What the Model Revealed and How It Can be Used
The mode choice model study area covered Cook County, which includes the City of Chicago, and six surrounding counties. Public transportation within the region is provided by the Chicago Transit Authority (buses and rapid transit trains), the Metra commuter rail system and the Pace system, which offers suburban and city bus service and paratransit. And, as one would expect, the area is served by an extensive roadway system that has an estimate 54,600 miles of streets and roads, according to the online Encyclopedia of Chicago History.
The model, of course, can be a pivotal resource to drive the direction of future transportation planning and policy decisions. But during the research process, the team identified some additional insight related to mode choice. Some key findings include:
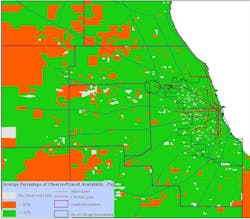
- Alternative modes of travel were not available to travelers for many trips studied. Reasons identified include: A lack of transit stops or stations close to the origin or destination, and a lack of transit service during the time of the trip.
- Researchers learned the importance of incorporating state-of-the-art data collected by companies similar to Google, NAVTEQ, and Microsoft in order to develop more effective planning transit related models.
- If the inclusion of Google and Bing map information proves to be accurate, this question surfaces: To what extent could a better model provide transit agencies and urban planners with a needed resource to improve transportation that enhances livability through reduced congestion, improved air and environmental quality, and more reliable public transit options that meet escalating demands?
Or, from another perspective, the model will help planners better understand what factors affect the behavior of people in terms of mode for travel selection. And, it opens up the need for further research into ways advancements in technology can help develop more accurate and “policy sensitive” models.
What to Anticipate for Mode Choice Modeling
Developing the mode choice model presented here -- which incorporated insight gained from satellite mapping images, street maps and real-time traffic conditions -- would not have been possible years ago. The framework created makes the simulation of people’s travel behavior, including their mode choice decision, more accurate by providing information of existing transportation network conditions as well as certain details of the trip and behaviors of the traveler.
From our research team’s perspective, the model is one component needed to tackle modern transportation challenges today and serves as a prelude to guide future research. We maintain that the mode choice model developed for Chicago can be adapted to other markets, and this study is a start toward building an even more accurate planning tool. Right now, the team is proposing a framework that would expand the existing home-based model to simulate different trips taken during a series of trips and incorporate the models into their highly dynamic activity-based travel demand model framework where demand and supply models communicate agents (vehicles and individuals) information during simulation.
As evidenced by recent transportation statistics, people today are more mobile than ever before. Research that culminates in potential solutions to modern challenges leads to improved public and personal transportation options in urban environments like Chicago and enhanced livability for the people who live, work and visit.
Dr. Abolfazl (Kouros) Mohammadian is Professor, Civil and Materials Engineering, College of Engineering, at the University of Illinois at Chicago. Mahmoud Javanmardi is a travel demand modeler/programmer at the Denver Regional Council of Governments. Both were on the research team that completed the mode choice project, which was managed by the Urban Transportation Center, a research unit at the University of Illinois at Chicago.

